

Table des matières
Jean Zay: The CEEMS energy measurement tool
What is CEEMS ?
The CEEMS energy measurement tool is available to Jean Zay users. It is an open-source tool (github link) with on-line documentation (doc link).
Note that the CEEMS tool is based on data obtained from compute nodes. These data do not take into account aspects such as the cooling, interconnection network, inputs/outputs, … If your goal is to evaluate your global carbon footprint by taking into account these aspects, you can use the values provided by GENCI on this subject. See this link .
Accessing CEEMS
On Jean Zay, CEEMS is accessible via a Single Sign-On (SSO) authentication service with your Jean Zay identifier and password at the following address: https://jean-zay-ceems.idris.fr.
The connection modalities are identical to those used to access JupyterHub, as explained on the Jupyterhub page.

Using CEEMS
From the home page, you need to follow the menu “Home > Dashboards > SLURM Job Metrics > User Job Summary”, if you are not already on this page.
The top of the displayed page presents as follows:
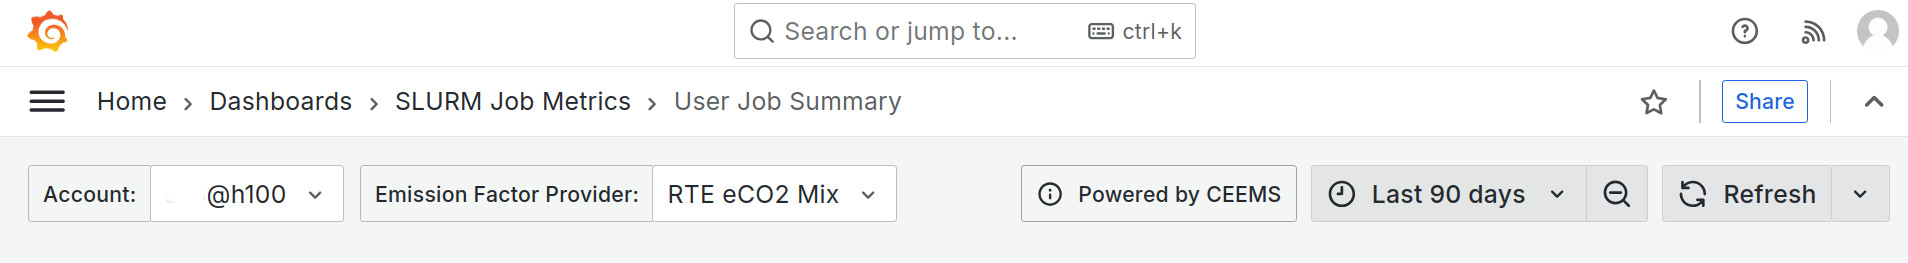
Measurement parameters
On this page, you can select the type of hours you want from the “Account“ drop-down menu (…@cpu, …@v100, …@a100 or …@h100). The available choices, as well as the default option, depend on the type of hours attributed to the project.
You can also choose the CO2 emission coefficient to use (varies in function of the coefficient reference chosen) by using the drop-down menu, “Emission Factor Provider”. This serves as the computing base for the quantity of CO2 emitted by your jobs. You can obtain information about the possible choices in the insert on the right of the page entitled “README”.
It is possible to choose the period of data analysis via the drop-down menu, “Last 90 days“ (which is the value by default).
Note that the drop-down menu “Refresh”, on the right, allows you to deactivate the automatic refresh or to activate it by choosing the frequency.
Displays
Depending on the preceding choices, you can consult the corresponding statistics for:
- Global usage per user, in the section “Aggregate Usage Statistics of User…”,

- Global usage for the project, in the section “Aggregate Usage Statistics of Project…”,

- The distribution of energy usage and emissions within the project, in the section “Breakdown of Energy and Emissions Usage …”,

- Your job metrics, in the section (“Job Metrics …”),

Each section contains a “README” which provides an introduction to the concerned section as well as a definition of the aggregated metrics presented.
Details per job
In the section “Job Metrics…”, only your jobs having a duration superior to 5 minutes on the selected partition are displayed. They appear several minutes after the start of the jobs (30 minutes at most). The information is then updated in real time (according to the refresh time frequency chosen).
By clicking on a job in the “Job Metrics” list, you will access the “Single Job Metrics” dashboard. In this dashboard, you will have the detailed statistics per node for this job (via the “Compute Node” drop-down menu) and perhaps per GPU (via the “GPU” drop-down menu), depending on the type of job (CPU or GPU).

The “Single Job Metrics” dashboard contains several sections such as CPU Stats, GPU Stats and GPU Profiling Stats. Definitions of the metrics presented in these sections are available in the Readme of this page. This page also supplies profiling data and I/O statistics. Note that to activate some of these functionalities, you must configure the corresponding environment variables, as indicated in the README.